3.1 Examples of time series
data(WWWusage, package = "datasets")
par(mai = c(0.9, 0.9, 0.1, 0.1), omi = c(0, 0, 0, 0))
plot.ts(WWWusage, ylab = "", las = 1, col = "blue", lwd = 2)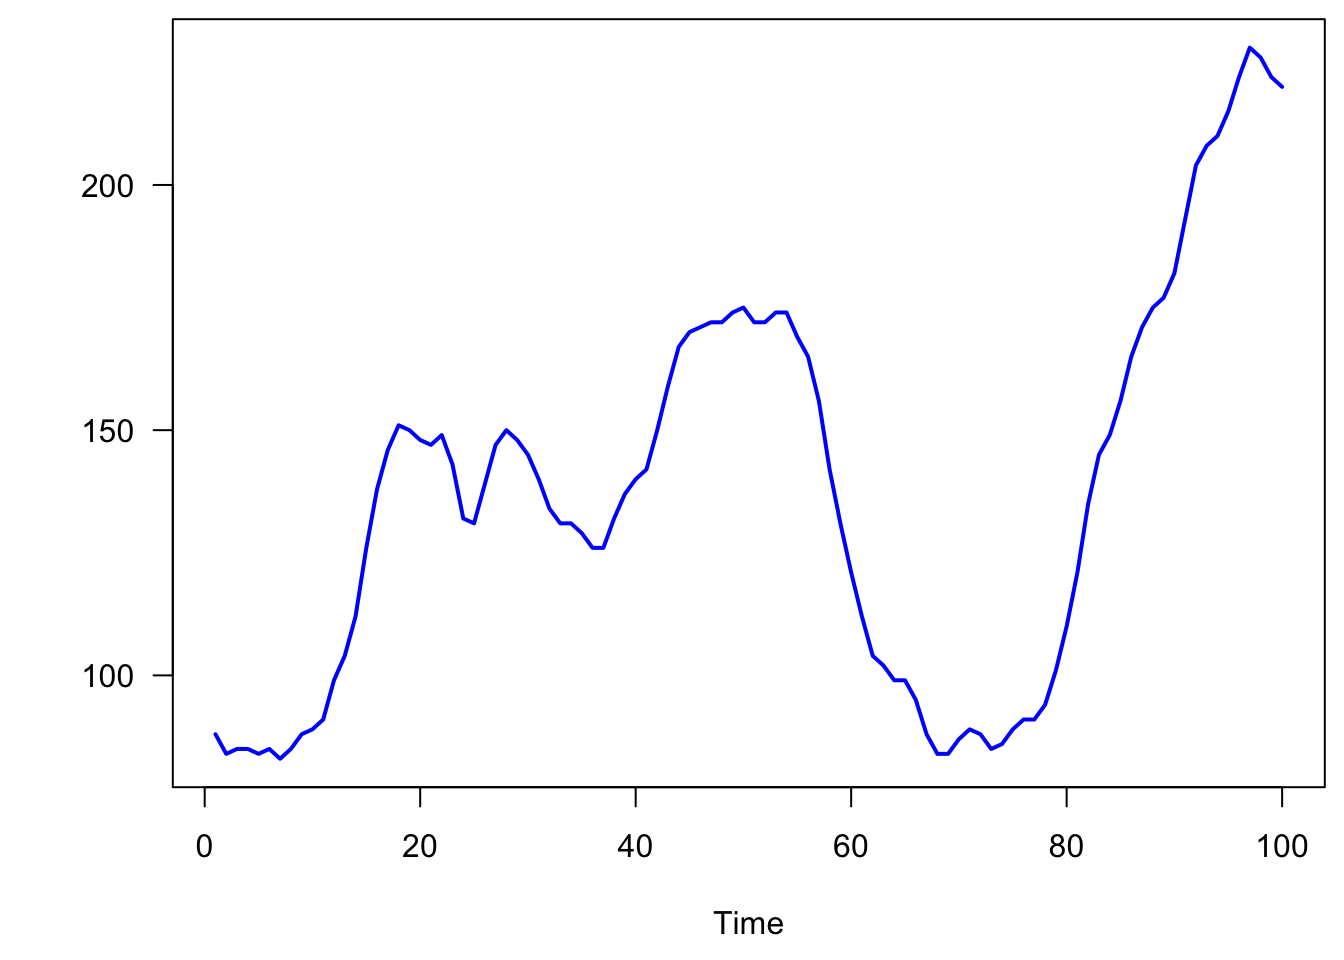
Figure 3.1: Number of users connected to the internet
data(lynx, package = "datasets")
par(mai = c(0.9, 0.9, 0.1, 0.1), omi = c(0, 0, 0, 0))
plot.ts(lynx, ylab = "", las = 1, col = "blue", lwd = 2)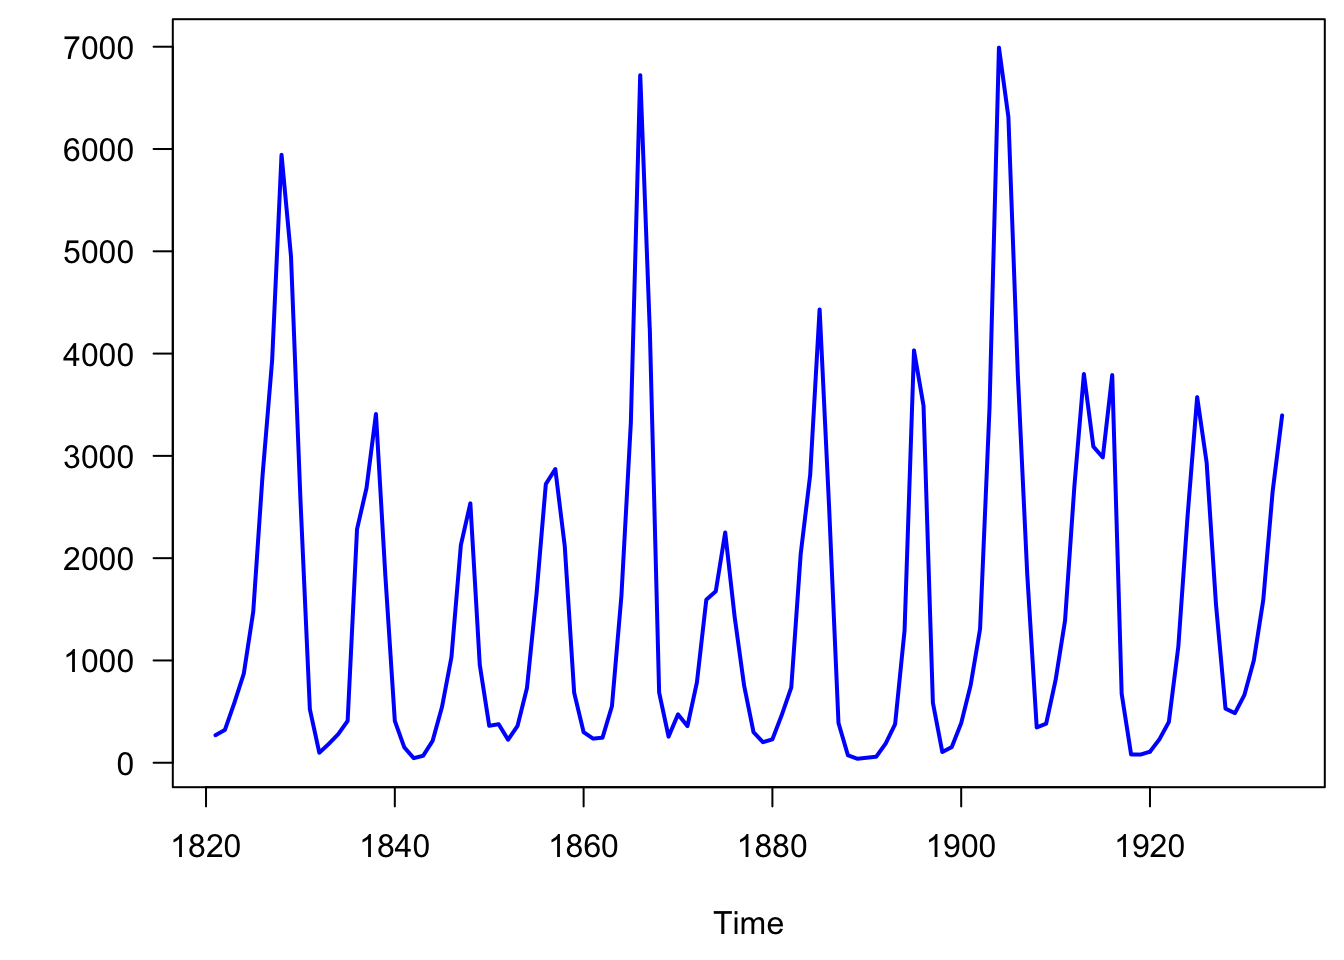
Figure 3.2: Number of lynx trapped in Canada from 1821-1934