Plot coefficients of top MAR models
plot.MARtop.RdPlots the coefficients of the best-fit models contained in the $top.bestfit component of an object of class MAR.
Usage
# S3 method for MARtop
plot(x, ...)
Arguments
- x
The
$top.bestfitcomponent of an object of classMAR- ...
Further arguments passed to or from other methods
Details
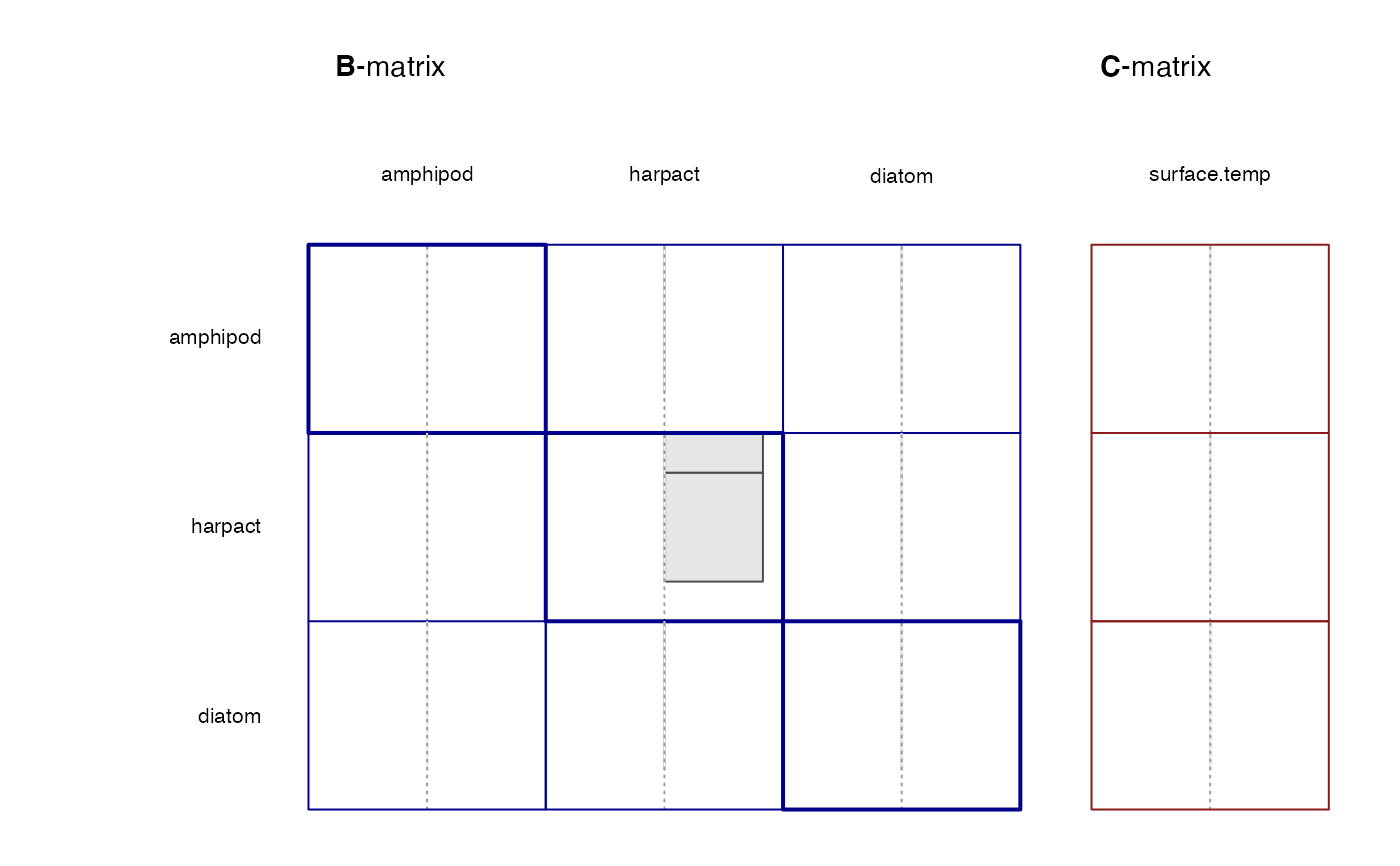
The B- and C-matrix coefficients of the top best-fit models are plotted as a grid of bar graphs, with the selected best-fit model represented by the top-most set of bars.
Examples
data(L4.mar)
myvar <- c(0, 0, 0, 1, 0, 0, 0, 0, 0, 0, 0, 0, 0, 1, 1, 0, 0, 0, 0, 0, 2)
myres <- matrix(0.5,
  nrow = length(which(myvar == 1)),
  ncol = length(which(myvar != 0))
)
small <- L4.mar[1:20,]
run1 <- run.mar(small, variables = myvar, restrictions = myres, search = "random", boot = FALSE)
#>
#>
#> searching for best-fit model...
#>        ...BEST-FIT MODEL SELECTED
#> 	           ( search time:  0 minutes 5 seconds )
#>
#>
#>
#> identifying 10 lowest AIC models...
#>        ...TOP MODELS RETAINED
#>
#> ════════════════════════════════════════════════════════════════════════════════
#>
#>

plot(run1$top.bestfit)